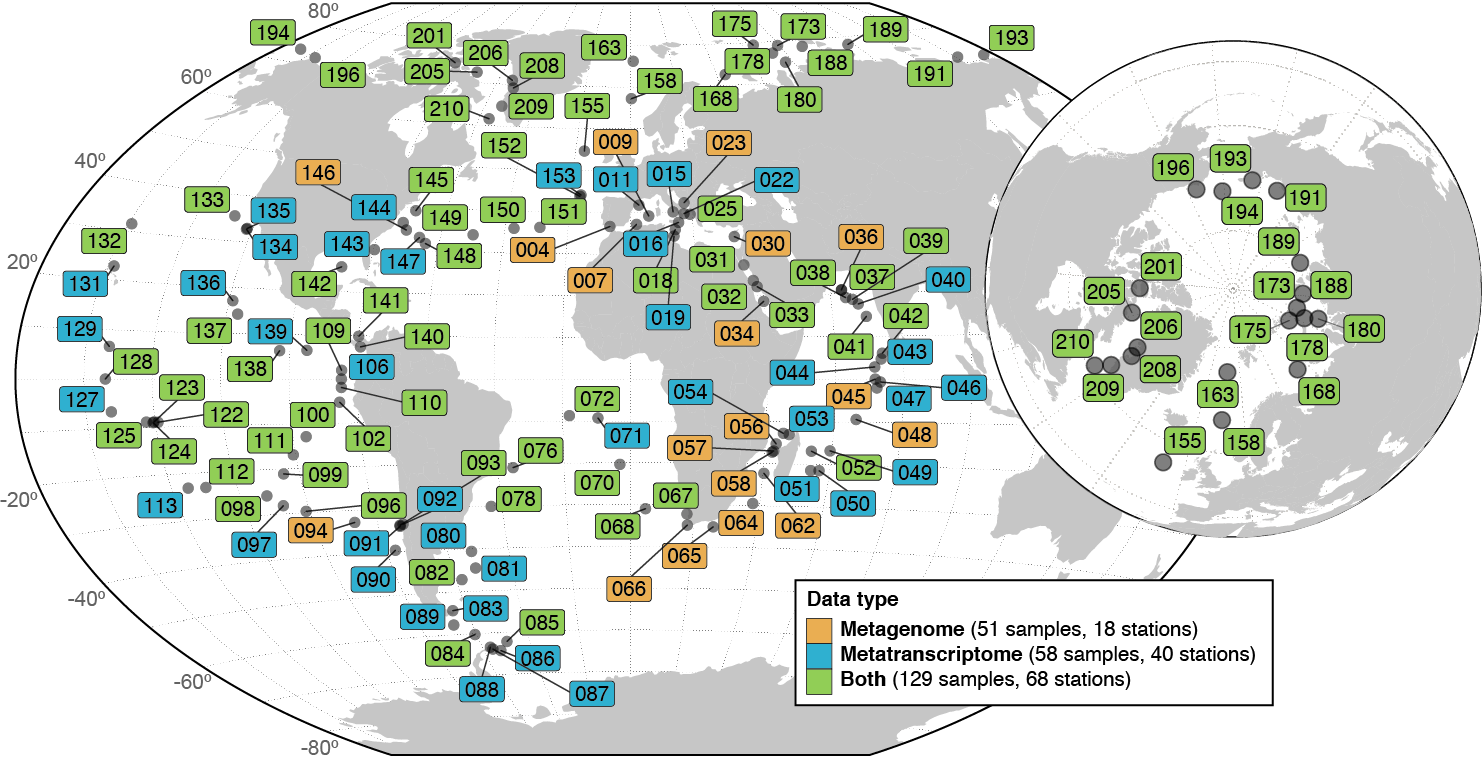
The numbers of prokaryotic-enriched samples and stations used for profiling are reported in the legend
Download: Companion Website Tables W1-W6
This spreadsheet file contains the following tables:
Table W1: Tara Oceans Sample description (557 samples)All data is available at EBI Biostudies. For additional information on the file-scheme, please refer to the following document: README
We assembled billions of DNA shotgun sequencing reads from 370 metagenomic samples. Genes were predicted on these "contigs" and were clustered to generate a non-redundant set of reference genes, the Ocean Microbial Reference Catalog v2 (OM-RGC.v2).
The complete catalog can be downloaded here:
OM-RGC.v2 [ Size: 9.7 GB ]
The complete set of predicted genes and metagenomic assemblies generated can be downloaded here:
Predicted genes: [ Size: 28 GB ]For each prokatyote-enriched sample (N=180), we extracted metagenomic merged Illumina reads (miTAGs) that contained signatures of the 16S/18S rRNA gene (Logares et al. 2013). These fragments were mapped to a set of 16S/18S reference sequences that were downloaded from the SILVA database (Release 128: SSU Ref NR 99) and clustered into 97% operational taxonomic units. Multiple hits were allowed, although only the miTAGs mapping to a unique reference sequence were used to compute Operational Taxonomic Units (OTUs) abundances. The miTAGs mapping to more than one reference sequence were further processed to determine their taxonomic affiliation at a higher taxonomic level. These were assigned to the taxonomic level (domain, phylum, class, order, family or genus) that was common to all the reference sequences based on their SILVA taxonomic annotation file (tax_slv_ssu_128.txt). Abundance tables at all levels were built by counting the number of miTAGs assigned to each taxa in each sample and the number of unassigned miTAGs.
Abundance tables can be downloaded here:
Abundance tables: [ Size: 1.3 MB ]After generating the reference gene catalog, reads from each sample were mapped to the catalog to estimate gene and functional abundances. For each prokaryote-enriched sample (N=180), the abundance of each gene in the OM-RGC.v2 was determined using MOCAT2 (Kultima et al. 2016). Based on the functional annotations of the OM-RGC.v2, these gene abundances were summarized at the level of: (i) eggNOG orthologous group, i.e. OGs (genes annoted to the eggNOG version 4.5 database: Huerta-Cepas et al. 2016) and (ii) KEGG orthologous groups, i.e. KOs (genes annoted to the KEGG release 86.1 database). Genes that were not annotated to any OG were clustered denovo to define uncharacterized gene clusters (GCs) and used for summarizing abundances at the level of (iii) OGs and GCs.
Gene profiles can be downloaded here:
Metagenomic gene profiles (N=180) [ Size: 8 GB ]Functional profiles were built for three different metrics: (i) metagenomic composition (gene abundance), (ii) metatranscriptomic composition (transcript abundance) and (iii) gene expression levels (transcriptomic abundance / gene abundance). Two different normalizations were used: (i) per-cell abundance and (ii) per-cell abundance + Variance stabilization + log2 (see STAR Methods for details).
Functional profiles can be downloaded here:
eggNOG profiles [ Size: 193 MB ]Silvia G. Acinas, Adriana Alberti, Marcel Babin, Peer Bork, Chris Bowler, Margaux Carmichael, Luis P. Coelho, Corinne Cruaud, Miguelangel Cuenca, Colomban de Vargas, Céline Dimier, Stefan Engelen, Joannie Ferland, Christopher Field, Ann C. Gregory, Lionel Guidi, Pascal Hingamp, Jaime Huerta-Cepas, Daniele Iudicone, Lee Karp-Boss, Eric Karsenti, Stefanie Kandels, Karine Labadie, Claudie Marec, Hiroyuki Ogata, Lucas Paoli, Eric Pelletier, Stéphane Pesant, Marc Picheral, Sergey Pisarev, Julie Poulain, Simon Roux, Marta Royo-Llonch, Hans-Joachim Ruscheweyh, Guillem Salazar, Pablo Sánchez, Sabrina Speich, Matthew B. Sullivan, Shinichi Sunagawa, Hideya Uehara, Patrick Wincker, Ahmed Zayed, Georg Zeller.
Silvia G. Acinas, Marcel Babin, Peer Bork, Emmanuel Boss, Chris Bowler, Guy Cochrane, Colomban de Vargas, Mick Follows, Gabriel Gorsky, Lionel Guidi, Nigel Grimsley, Pascal Hingamp, Daniele Ludicone, Olivier Jaillon, Stefanie Kandels, Lee Karp-Boss, Eric Karsenti, Fabrice Not, Hiroyuki Ogata, Nicole Poulton, Stéphane Pesant, Jeroen Raes, Christian Sardet, Sabrina Speich, Lars Stemmann, Matthew B. Sullivan, Shinichi Sunagawa, Patrick Wincker.